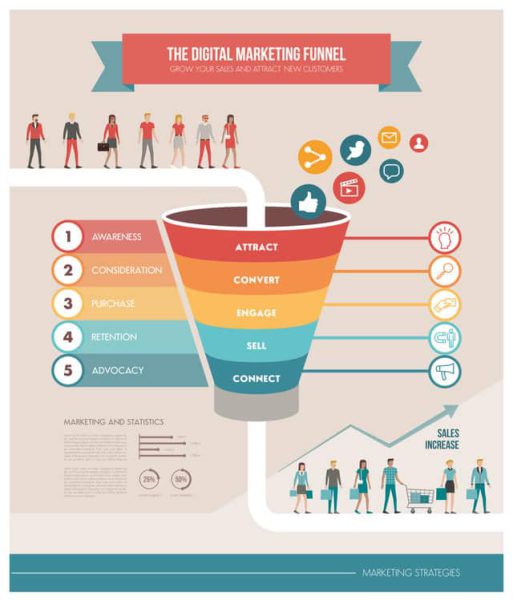
Did you know that people only remember 20% of what they read, but up to 80% of what they see? If you keep this in mind, you will understand why infographics are so successful at conveying a message to an audience. Eand infographic is a graphic representation of information in text, but especially in images. It is, as it were, an informative poster consisting of a combination of images, diagrams or graphs with as little text as possible. Nowadays there are so many stimuli and information available that our brain has to filter and select and then make the choice whether or not to absorb and process certain information. Let infographics be the way to get through these filters.
Infographic as part of SEO
Did you know that infographics contribute to... SEO? An infographic provides incoming links to your website. In addition, you, or people who find it interesting, will probably share it on social media. This in turn also creates more traffic and awareness. The next question is what such an infographic should look like. When is something a good infographic? What information is important and what information should I leave out? Every infographic is of course different, but there are a number of basic elements that can help you get started.
Did you know…?
Before you start working on your infographic, it is good to be clear about what exactly you want to talk about and what the approach will be. An infographic contains little text, so think about how you can convey your point of view to the audience in as few words as possible. A tip: make use of shocking or interesting facts. Above all, keep it short and sweet and use images or graphs where possible to emphasize your point. What makes infographics easy on the eye is when there is consistency in the color scheme and images. So go for a color scheme that is not too complicated and suits your subject. Try to make the images the same size, or at least in the same style. This keeps the overall atmosphere of the infographic calm and makes it easy to follow for the reader. When you create a digital infographic, you can link internally to your website to generate more traffic. The standard layout of an infographic is vertical, so it is recommended to place your information at the bottom. When you print the infographic and place it somewhere, you can add a QR code that, for example, links to your website. Would you like to create an infographic as part of your SEO? You will notice that you not only teach your audience more about a certain topic, but you will also gain interesting knowledge yourself while creating the infographic. Look at here Here are some examples to give you some inspiration and who knows, we might see your infographic on social media soon!


0 comments